The Carnot cycle and heat engine efficiency
Engineering · Senior school and first-year engineering · about 8 min
Every power station and car engine turns heat into work, and every one of them throws some heat away. The Carnot cycle is the ideal, perfect engine. It sets the best possible efficiency for any engine working between two temperatures, which makes it a powerful reality check.
The key idea
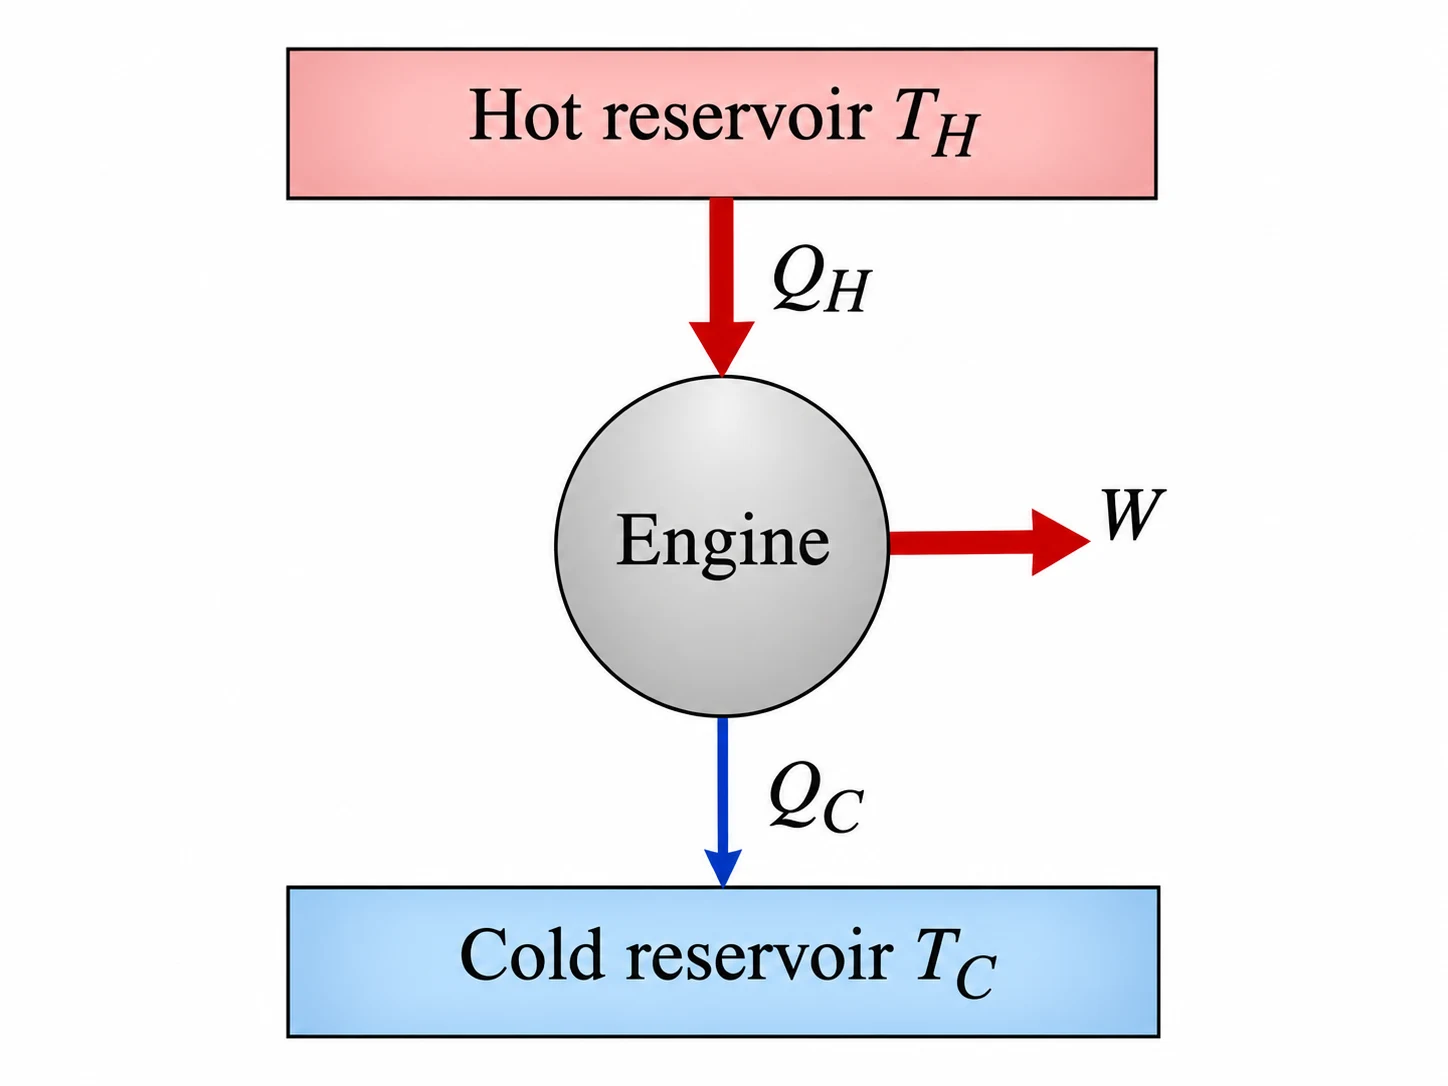
An engine taking heat from a hot reservoir at and rejecting heat to a cold one at (temperatures in kelvin) can never beat
and for any engine, with .
Why some heat must be thrown away
The second law of thermodynamics says you can't turn heat into work in a cycle without rejecting some heat to something colder. That rejected heat is why car radiators and power-station cooling towers exist, and why is always below .
The four steps of the Carnot cycle
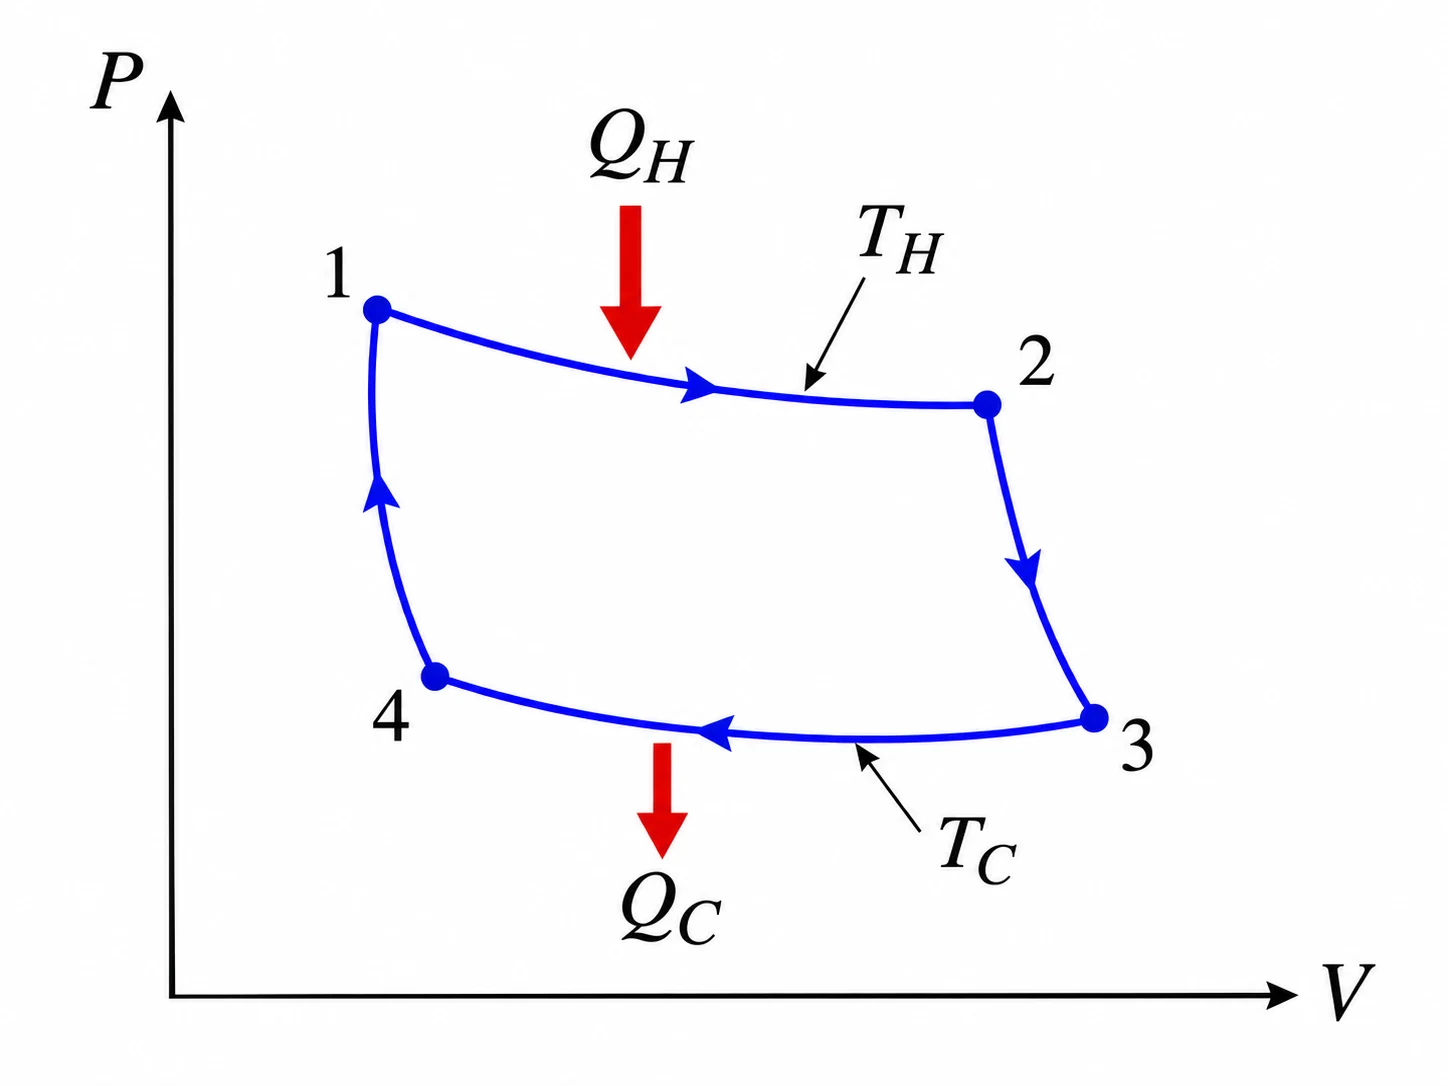
- Isothermal expansion at : heat flows in.
- Adiabatic expansion: the gas cools from to with no heat flow.
- Isothermal compression at : heat flows out.
- Adiabatic compression: back up to .
Every step is reversible, which is what makes it the upper limit. Real engines have friction and fast, irreversible heat transfer, so they do worse.
Worked example: checking an engine claim
An engine runs between K and K and takes in J of heat per cycle. What is the most work it could produce? A company claims an engine between the same temperatures that is efficient. Is that possible?
Show the solution
Carnot efficiency:
Maximum work per cycle:
The other J at least must be rejected to the cold reservoir.
The claim: , so it's impossible. No engine between K and K can beat the Carnot limit.
Common mistakes
Using degrees Celsius in the efficiency formula
The formula needs absolute temperatures. Add to convert °C to K.
Expecting a real engine to reach the Carnot efficiency
Carnot is the ceiling for a perfect, reversible engine. Real engines are always lower.
Thinking better insulation could make it 100% efficient
The heat rejected at is required by the second law, not a leak you can plug.
Check your understanding
1. What is the Carnot efficiency between K and K?
2. To raise the maximum possible efficiency, you should...
3. An engine takes in J and does J of work. How much heat does it reject?
Still not sure? Talk it through.
Waypoint Mentor's tutor explains this out loud, works through your own problems on a whiteboard, and checks you've got it. Free to start.