Graphs of functions and transformations
Mathematics · Senior school maths · about 10 min
A graph is a picture of a function: every point on it satisfies . Being able to sketch one quickly, and to see how changing the equation moves the curve, makes algebra, calculus and physics problems far easier to picture.
The key idea
Starting from , each change to the equation moves the graph in a predictable way:
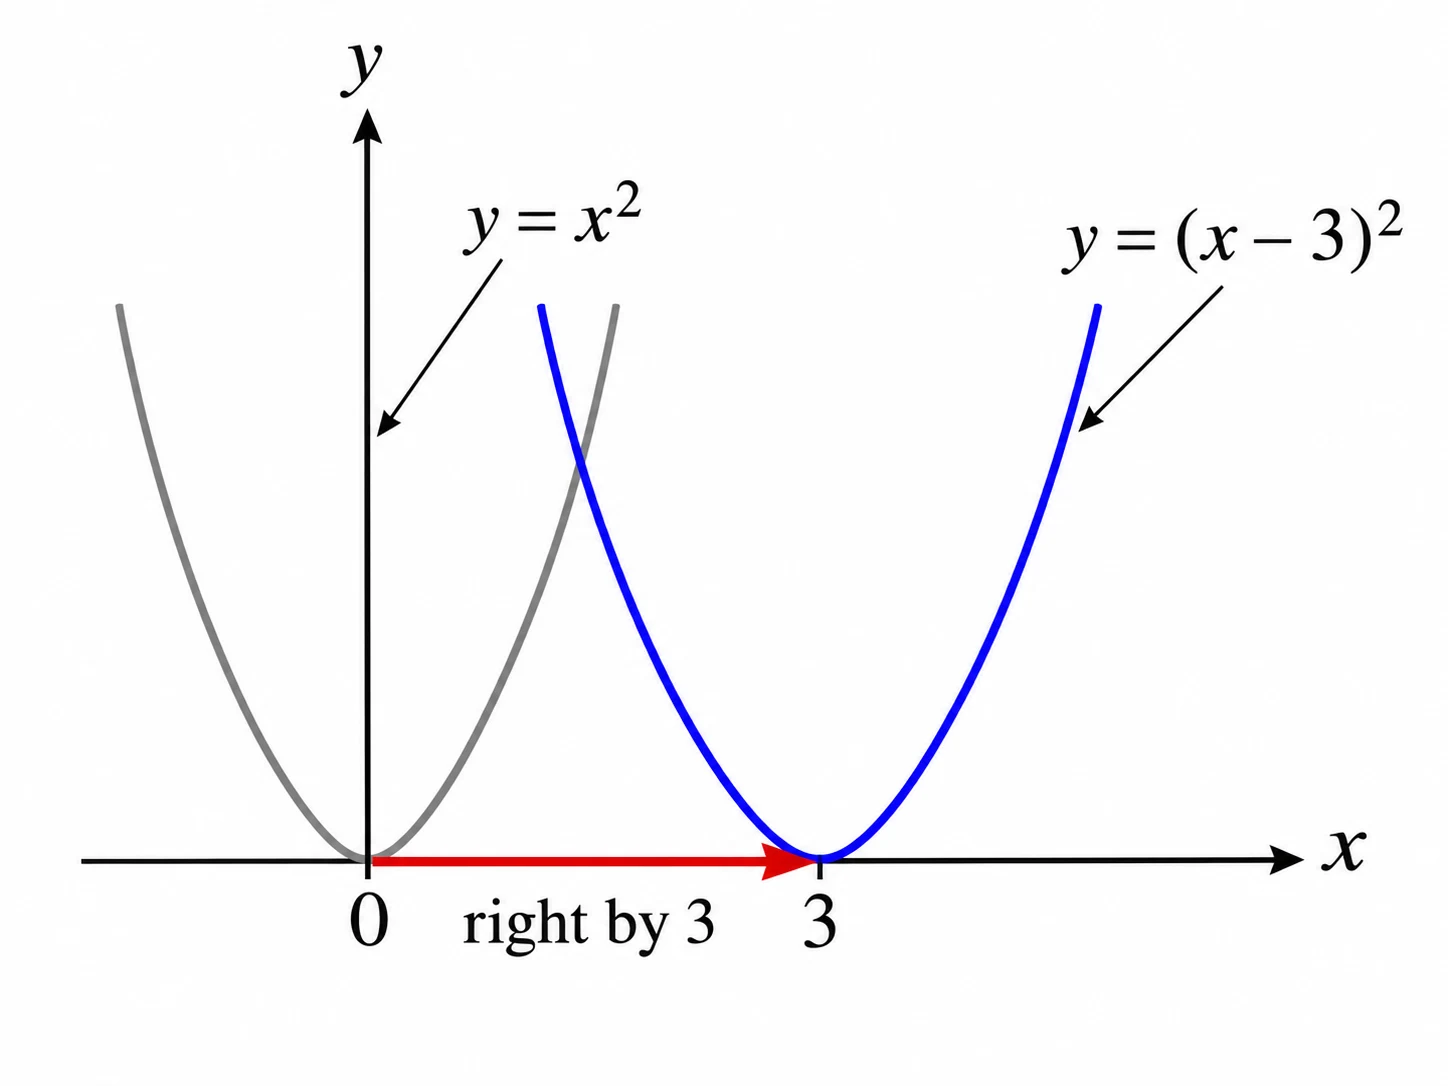
- shifts it right by , and shifts it up by ;
- stretches it vertically (and flips it if );
- squashes it horizontally by a factor of .
Try it yourself
What to find before you sketch
- -intercept: put .
- -intercepts (roots): solve .
- Turning points: for a parabola the vertex is at ; in general, where .
- Behaviour at the ends: what happens as gets very large or very negative.
- Asymptotes for functions like or .
Why the horizontal shift looks backwards
is moved right by , even though there's a minus sign. The vertex is where the bracket is zero, at . A good check: ask which value now produces what used to.
Worked example: sketching a parabola
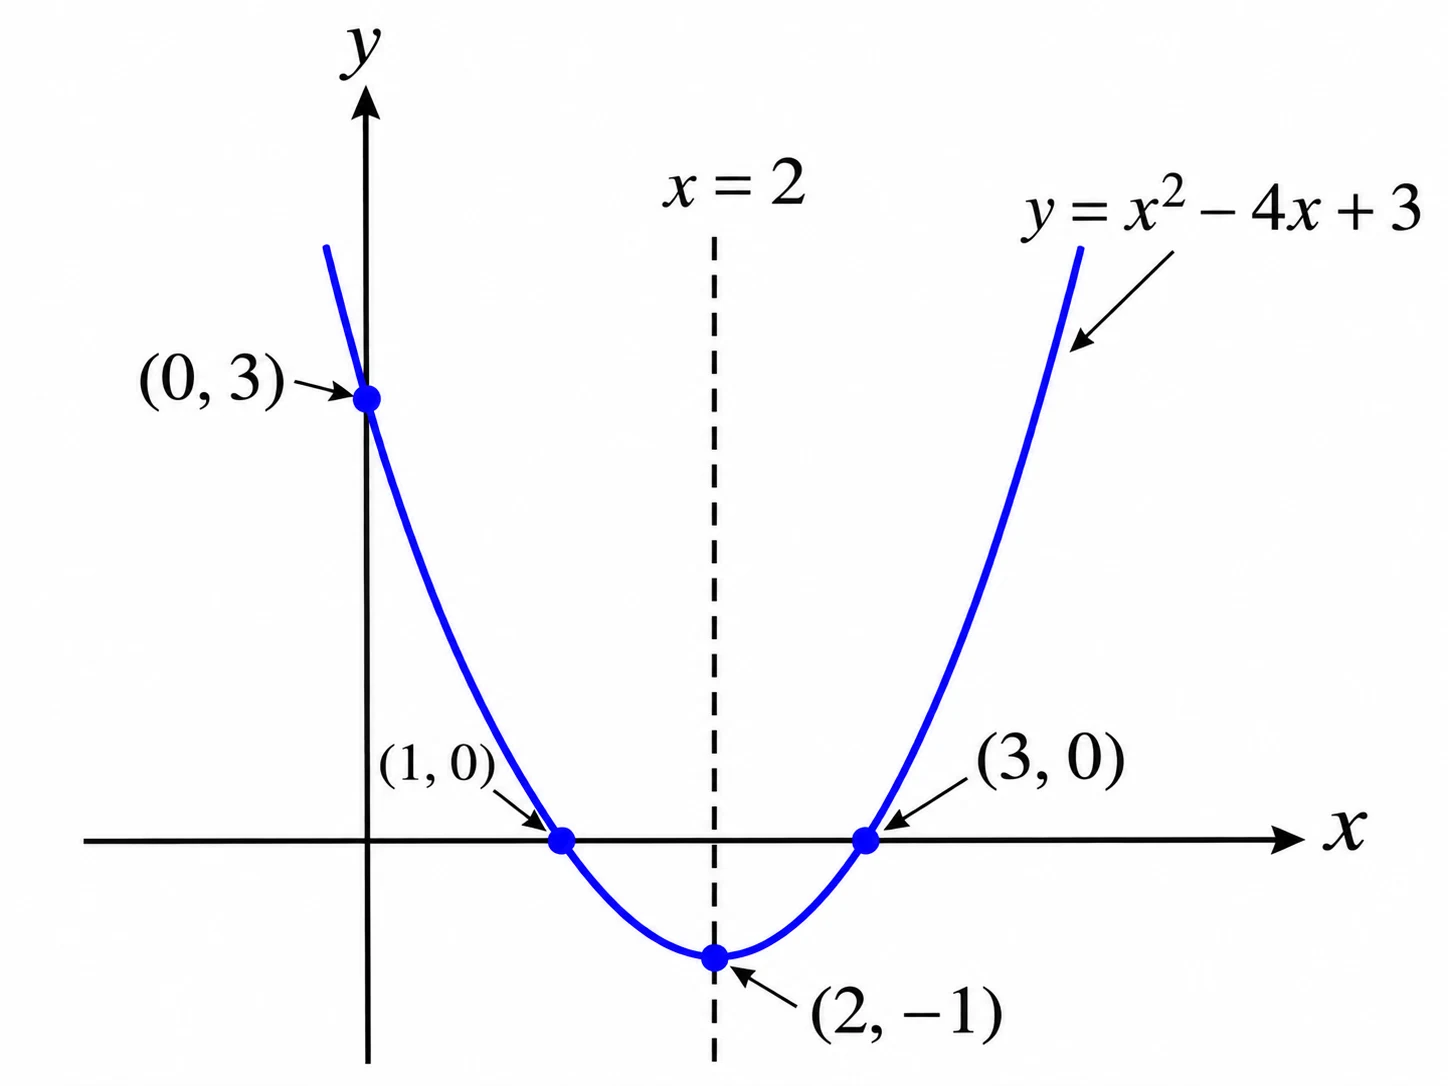
Sketch : find its intercepts and its vertex.
Show the solution
-intercept: at , .
Roots: , so and .
Vertex: , and , so the vertex is .
Completing the square gives the same thing: , which is shifted right and down . It opens upwards because the coefficient is positive.
Common mistakes
Shifting to the right
means : the graph moves left by .
Forgetting the vertex is halfway between the roots
For a parabola the axis of symmetry sits midway between the roots, here at .
Plotting points without checking the shape first
Find the intercepts and turning point first; then a couple of extra points are enough to sketch it accurately.
Check your understanding
1. What is the vertex of ?
2. How does compare with ?
3. Where does cross the -axis?
Still not sure? Talk it through.
Waypoint Mentor's tutor explains this out loud, works through your own problems on a whiteboard, and checks you've got it. Free to start.