The normal distribution
Statistics · Senior school and first-year statistics · about 10 min
Heights, exam marks and measurement errors often pile up around an average in a symmetric bell shape: the normal distribution. Knowing its shape lets you answer questions like "what fraction of people are taller than 182 cm?" from just the mean and standard deviation.
The key idea
A normal distribution is set by its mean and standard deviation . To find probabilities, convert a value to a z-score, how many standard deviations it is from the mean:
then look up in a table or calculator.
Try it yourself
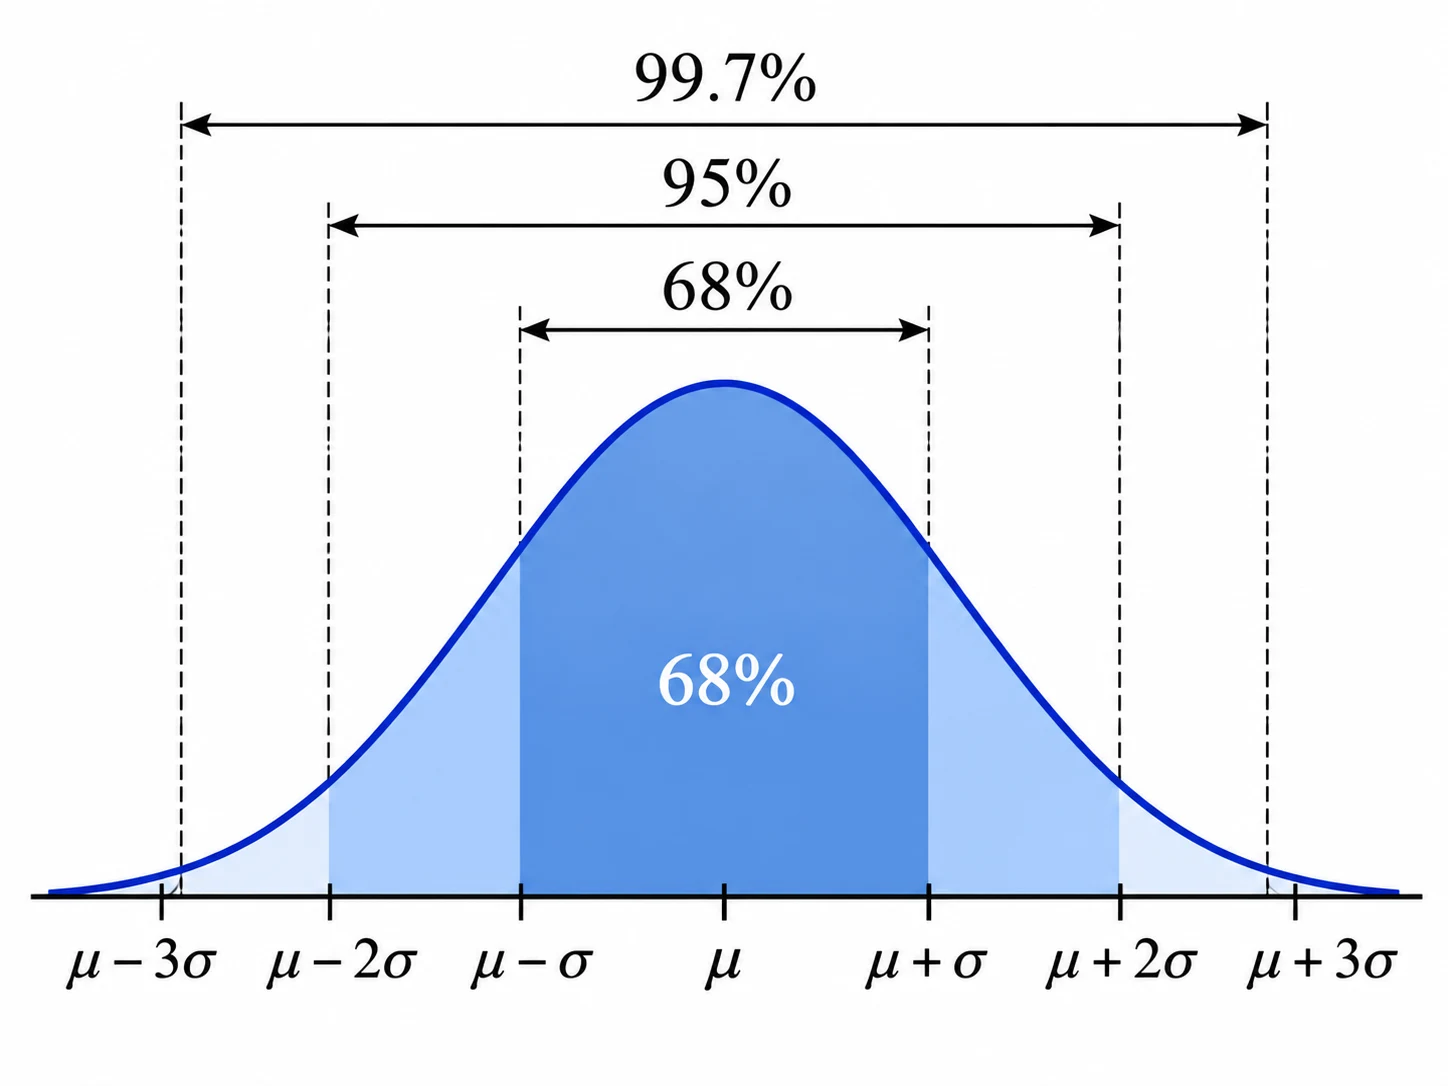
The 68-95-99.7 rule
For any normal distribution:
- about of values lie within of the mean,
- about within ,
- about within .
It's the quickest sense-check for any answer.
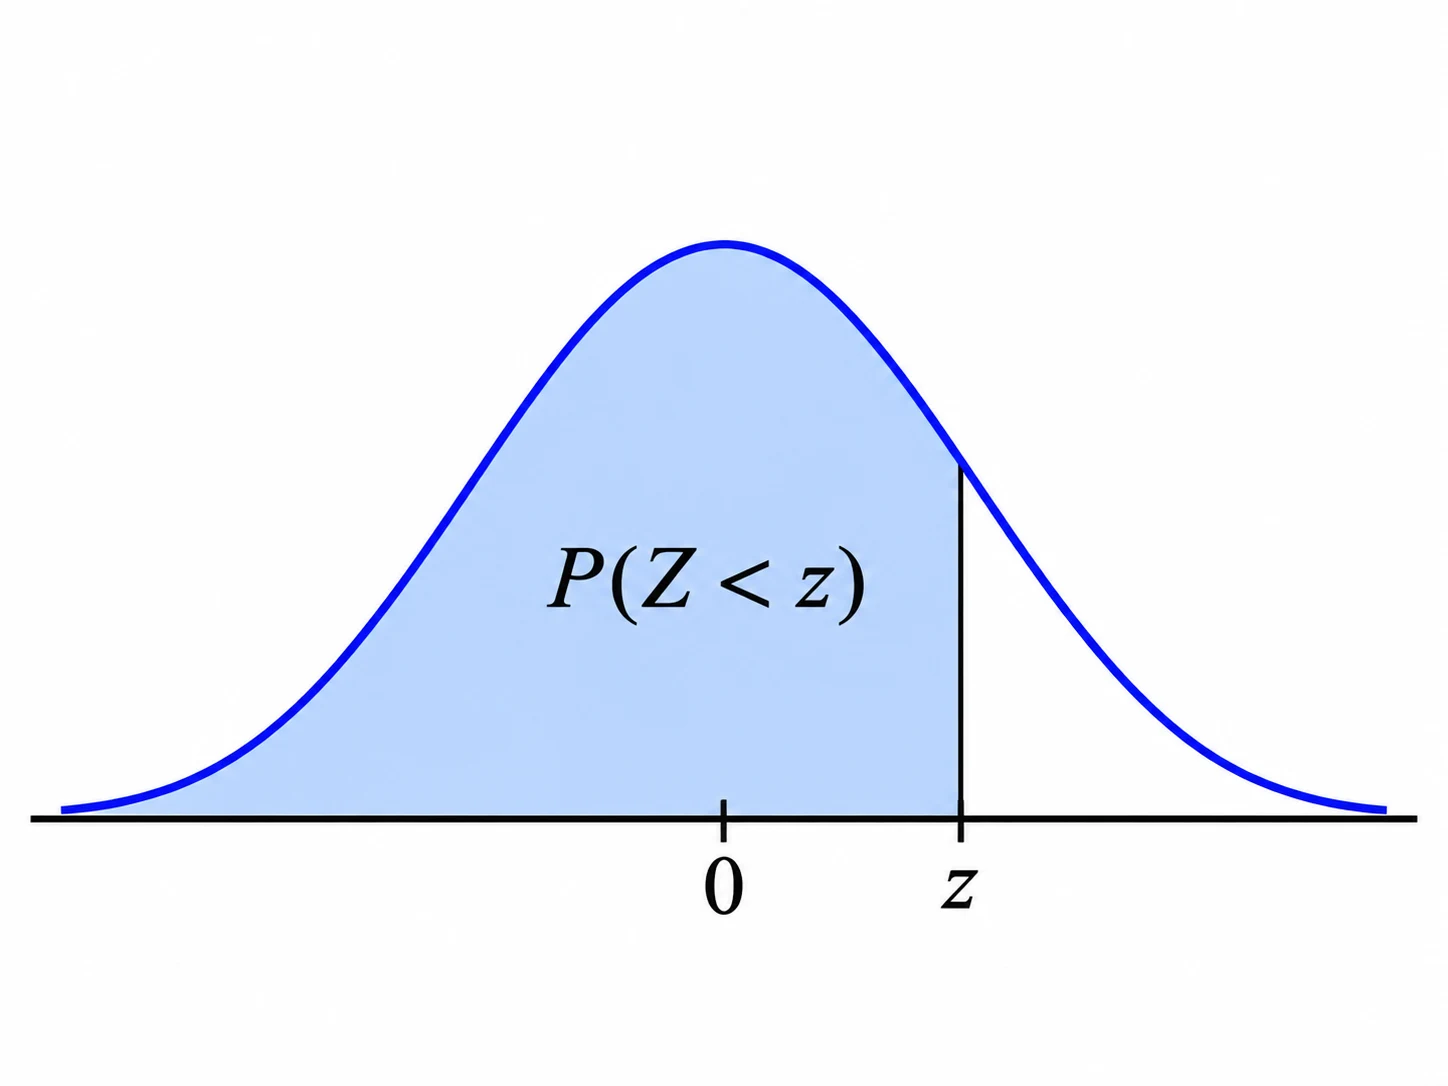
Using the table
Standard tables give , the area to the left of .
- Area to the right:
- Between two values:
- By symmetry, .
Worked example: heights of students
Heights are normally distributed with mean cm and standard deviation cm. What fraction of students are shorter than cm? What fraction are between and cm?
Show the solution
Shorter than cm:
So about are shorter than cm.
Between and cm: these are and .
About , exactly as the 68-95-99.7 rule predicts.
Common mistakes
Forgetting to convert to a z-score
Tables are for the standard normal (, ). Convert with first.
Reading the table as the area to the right
Most tables give the area to the left. Subtract from for "greater than".
Using the variance instead of the standard deviation
is the square root of the variance. If you're given , then .
Check your understanding
1. Marks have mean and standard deviation . What is the z-score of a mark of ?
2. About what percentage of a normal distribution lies within two standard deviations of the mean?
3. If , what is ?
Still not sure? Talk it through.
Waypoint Mentor's tutor explains this out loud, works through your own problems on a whiteboard, and checks you've got it. Free to start.