Present worth and the time value of money
Engineering · Engineering economics · about 10 min
A dollar today is worth more than a dollar in five years, because today's dollar can be invested and earn interest. Engineers use this idea to compare projects with costs and savings spread over many years, by converting everything to its value today: its present worth (PW).
The key idea
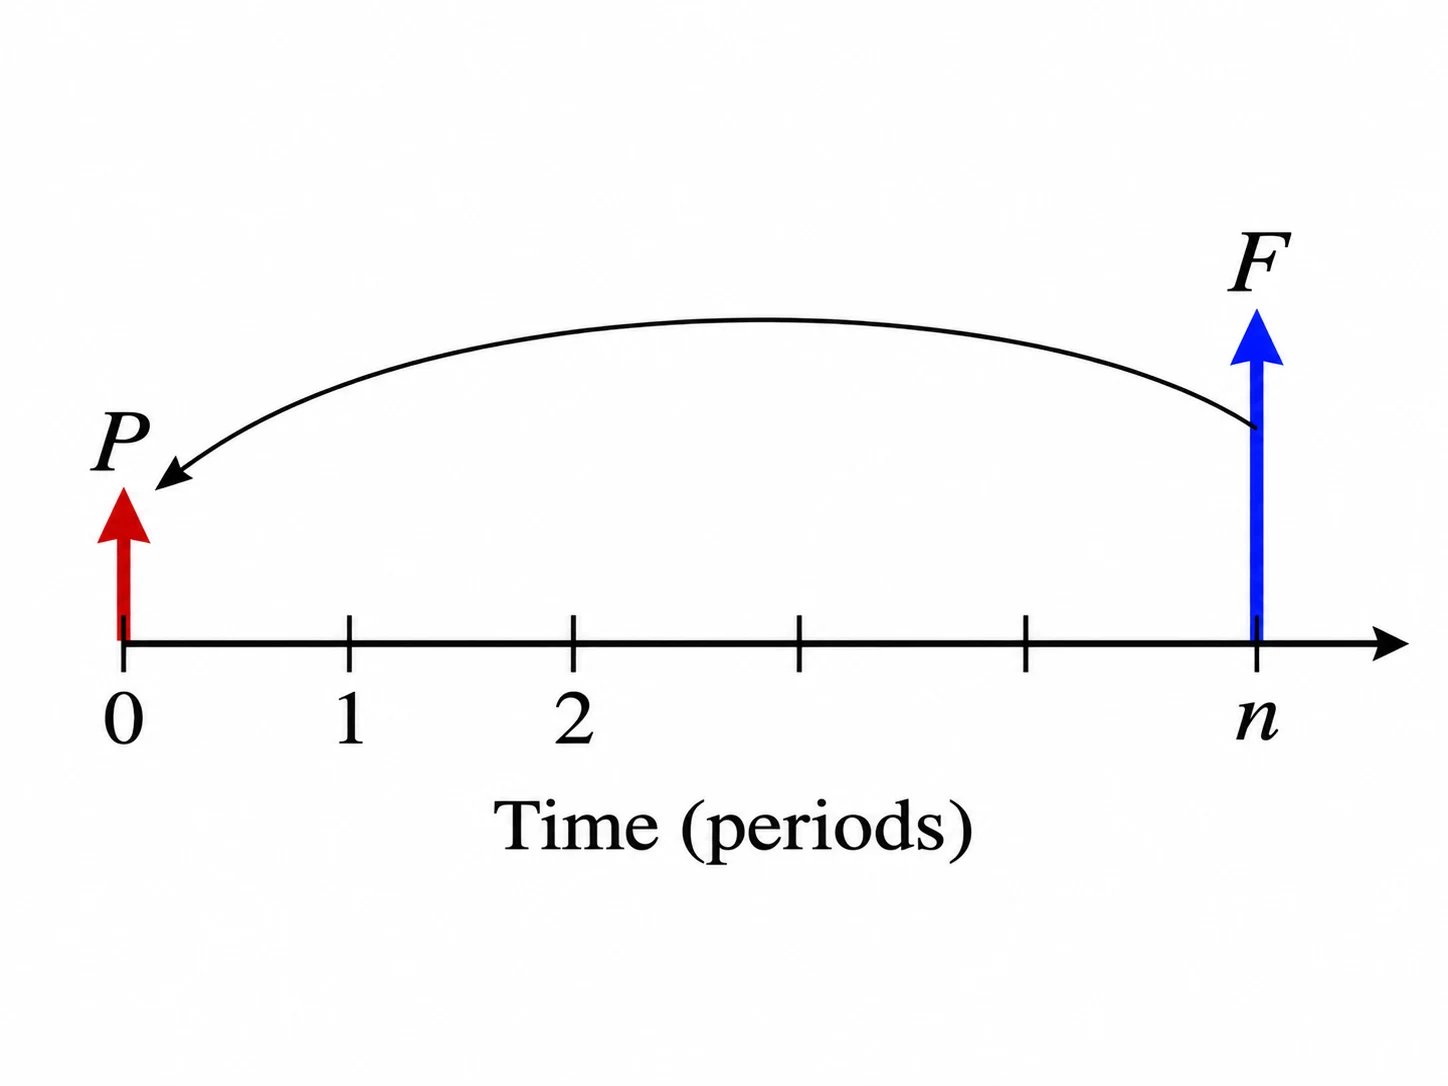
At interest rate per period, a single amount received periods from now is worth today
and an equal payment every period for periods is worth
Compounding and discounting
Investing at rate grows to after periods: that's compounding. Running it backwards, from a future amount to today's value, is discounting. The rate used for this in engineering decisions is often the company's MARR, the minimum attractive rate of return.
Using PW to make decisions
- For a single project: if its net present worth at the MARR is , it earns at least the MARR, so it's economically justified.
- For mutually exclusive options with equal lives: pick the one with the highest PW (or the least negative, when comparing costs only).
- Options with different lives must be compared over the same period, for example the least common multiple of their lives.
Worked example: a single payment and an annual series
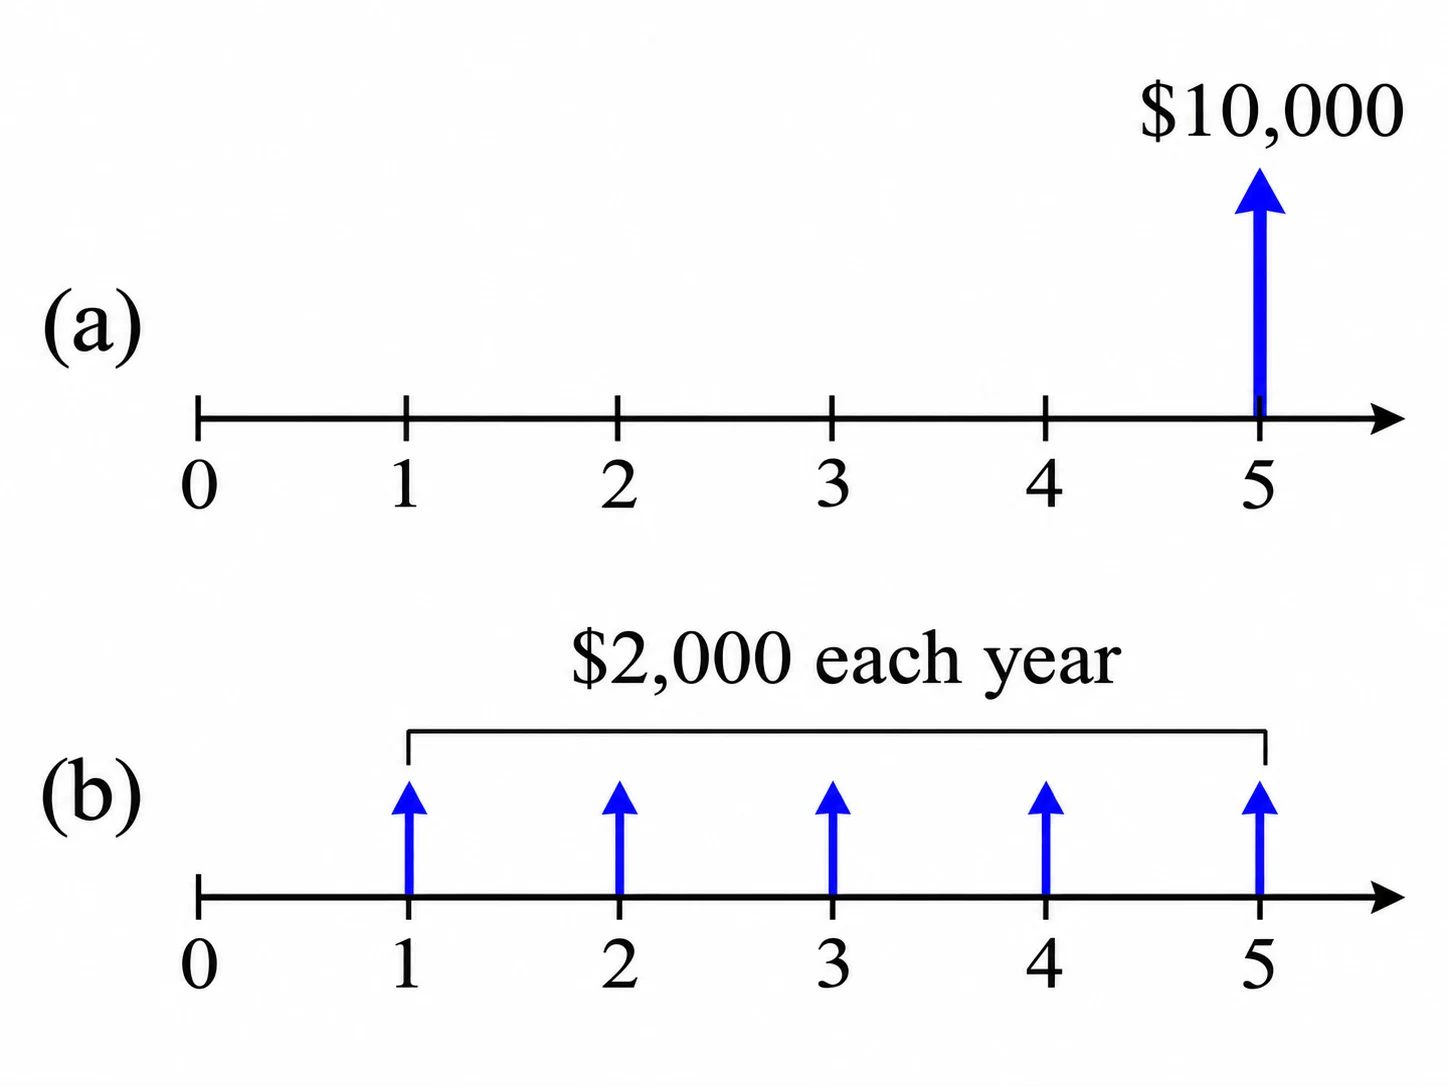
At per year: (a) what is $10,000 received in years worth today? (b) what is $2,000 received at the end of every year for years worth today?
Show the solution
(a) Single amount:
(b) Uniform series. The series factor is
so
Even though (b) pays out $10,000 in total, the same as (a), it's worth more today because the money arrives sooner on average.
Common mistakes
Adding future amounts without discounting them
Money at different times can't be added directly. Bring every amount to the same point in time first.
Using the interest rate as a percentage in the formula
Use , not .
Placing annual payments at the start of each year
The standard series formula assumes payments at the end of each period. Payments at the start need adjusting.
Check your understanding
1. As the interest rate rises, the present worth of a fixed future amount...
2. A project's net present worth at the MARR is +\1{,}200$. What does that tell you?
3. What is \10\%$?
Still not sure? Talk it through.
Waypoint Mentor's tutor explains this out loud, works through your own problems on a whiteboard, and checks you've got it. Free to start.