Supply and demand
Economics · Senior school and first-year economics · about 8 min
Why does a concert ticket cost what it does, and why do rent controls lead to waiting lists? The supply and demand model explains how buyers and sellers together settle on a price, and what happens when that price is held away from where the market wants it.
The key idea
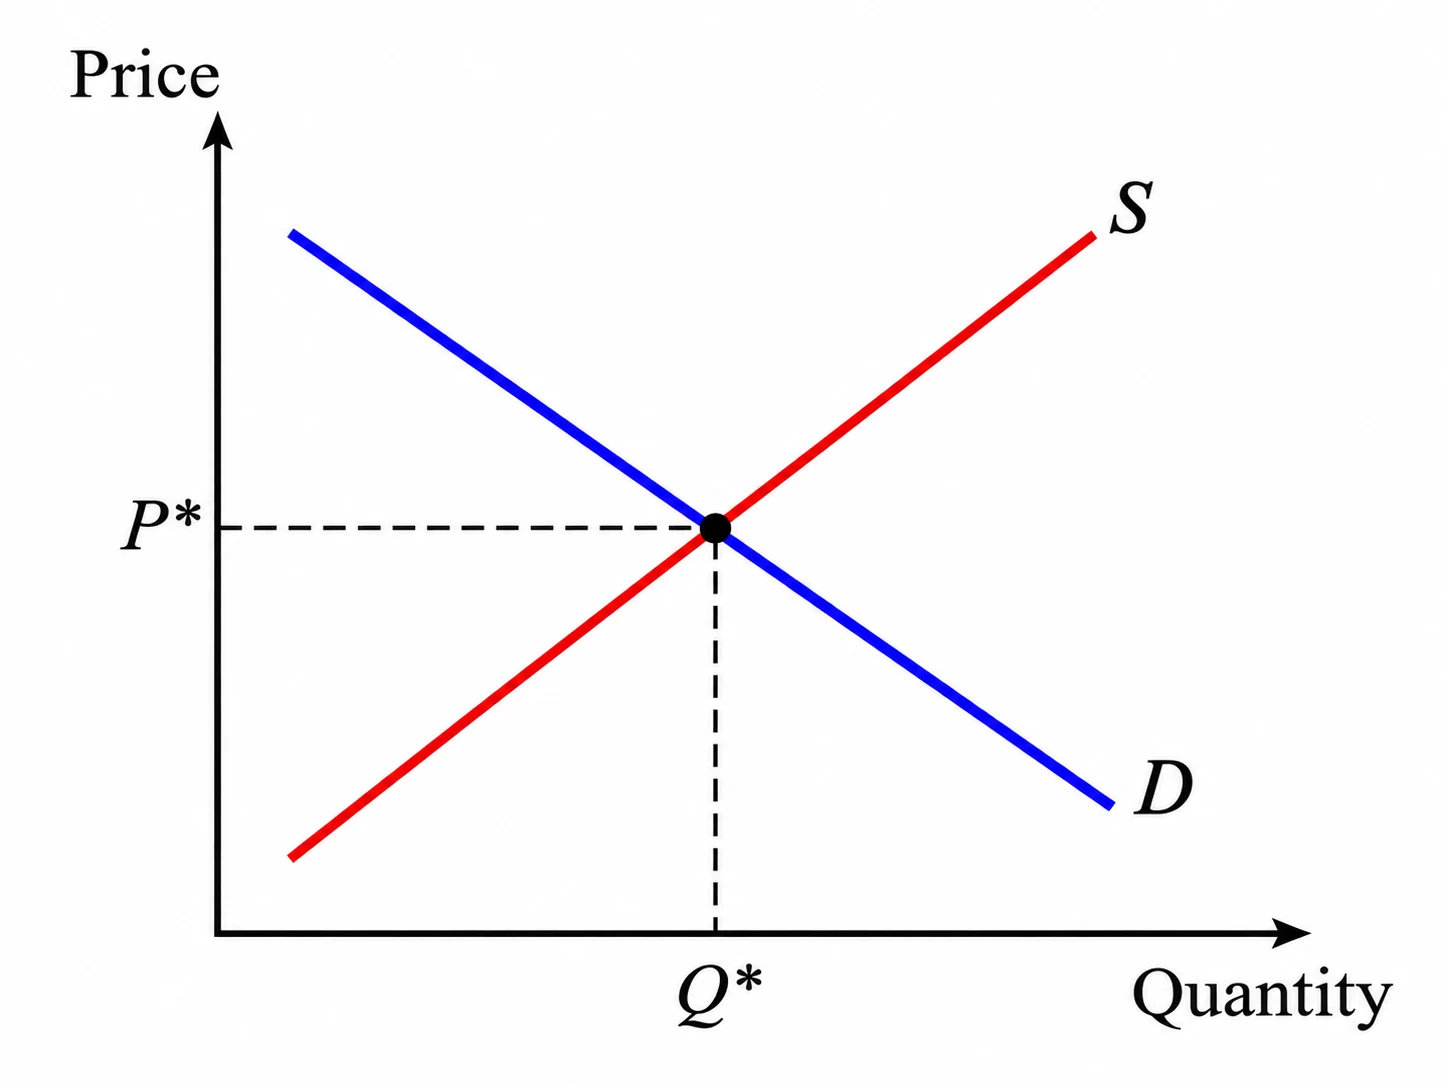
The market settles at the equilibrium, where the quantity buyers want equals the quantity sellers offer:
Below that price there's a shortage (); above it there's a surplus ().
Why the curves slope the way they do
- Demand slopes down: at a higher price, people buy less, or switch to something else.
- Supply slopes up: at a higher price, it's worth producing more.
A change in price moves you along a curve. A change in anything else (incomes, input costs, tastes) shifts the whole curve.
Price ceilings and floors
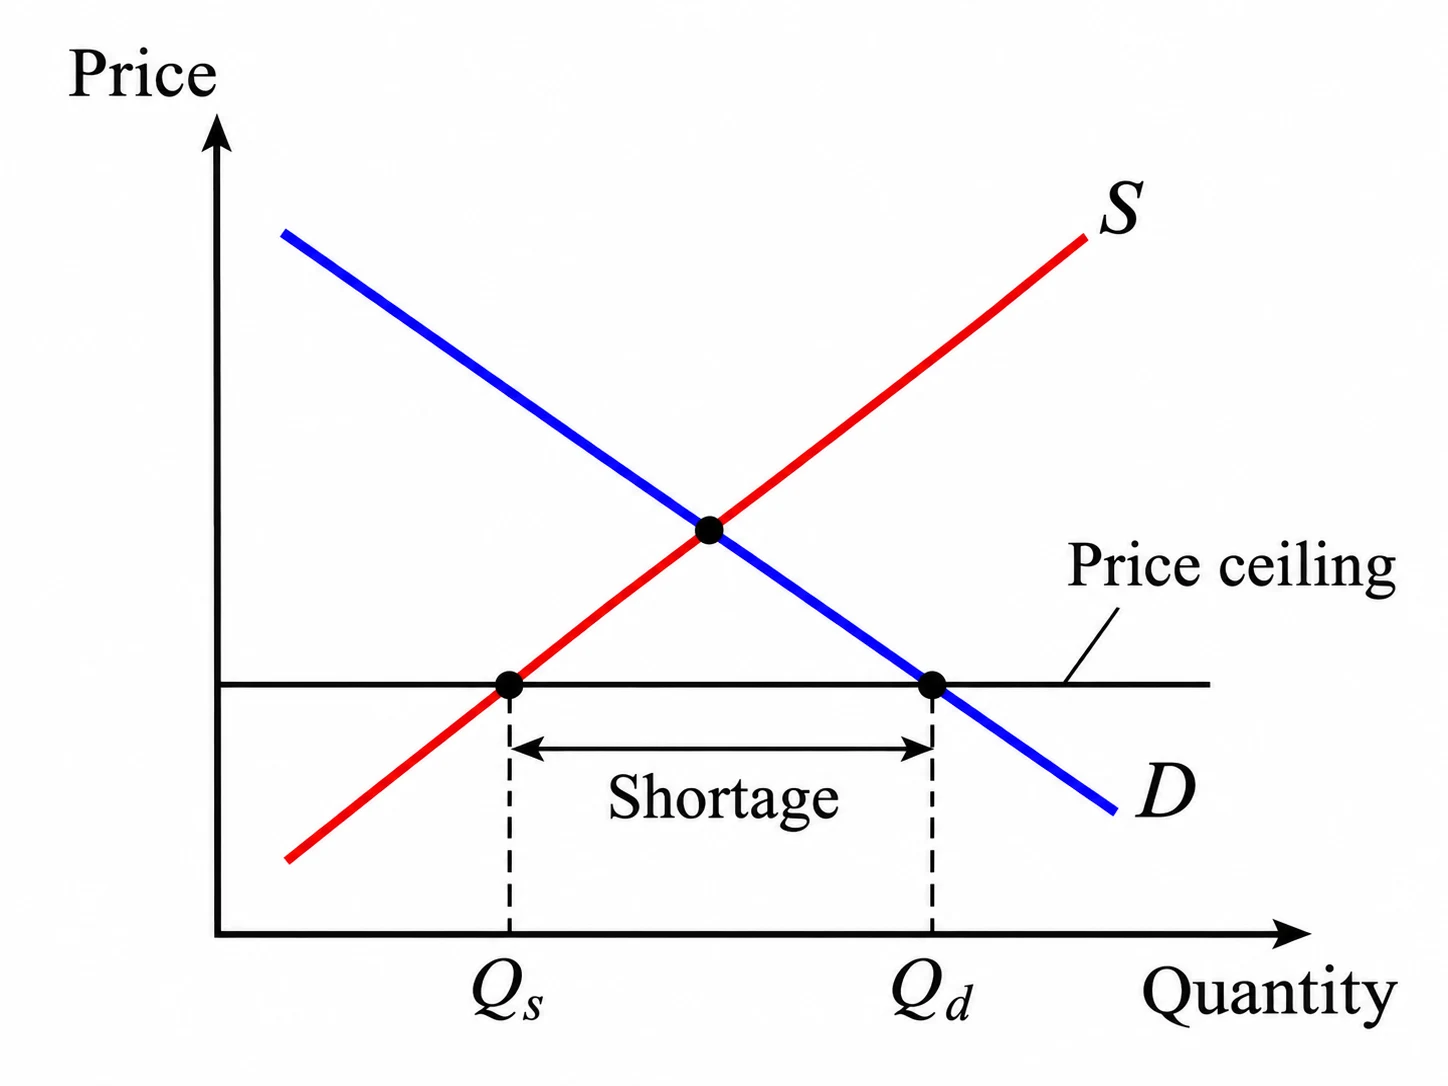
A price ceiling set below the equilibrium (like some rent controls) stops the price rising, so demand outstrips supply and there's a lasting shortage. A price floor set above equilibrium (like a minimum wage in labour markets) creates a surplus. A ceiling above equilibrium, or a floor below it, does nothing.
Worked example: equilibrium and a price ceiling
Demand is and supply is . Find the equilibrium price and quantity. Then a price ceiling of is imposed: what happens?
Show the solution
Equilibrium: set .
With a ceiling of (below , so it binds):
There's a shortage of units: buyers want , but only are supplied.
Common mistakes
Confusing a shift of the curve with a move along it
A price change moves you along the curve. Other changes, like a rise in income, shift it.
Thinking every price ceiling causes a shortage
Only a ceiling below equilibrium binds. One above it has no effect.
Solving for quantity before price
Set , solve for , then substitute back into either equation for .
Check your understanding
1. Demand is and supply is . What is the equilibrium price?
2. A price ceiling set below the equilibrium price causes...
3. Consumers' incomes rise and the good is a normal good. What happens to its demand curve?
Still not sure? Talk it through.
Waypoint Mentor's tutor explains this out loud, works through your own problems on a whiteboard, and checks you've got it. Free to start.