Confidence intervals
Statistics · First-year university statistics · about 10 min
A sample estimate is rarely identical to the population value. A confidence interval adds a margin of error to an estimate, showing a range produced by a repeatable method. The interval width depends on variability, sample size and confidence level. Exam questions often require both the arithmetic and a careful interpretation of what the confidence percentage means.
The key idea
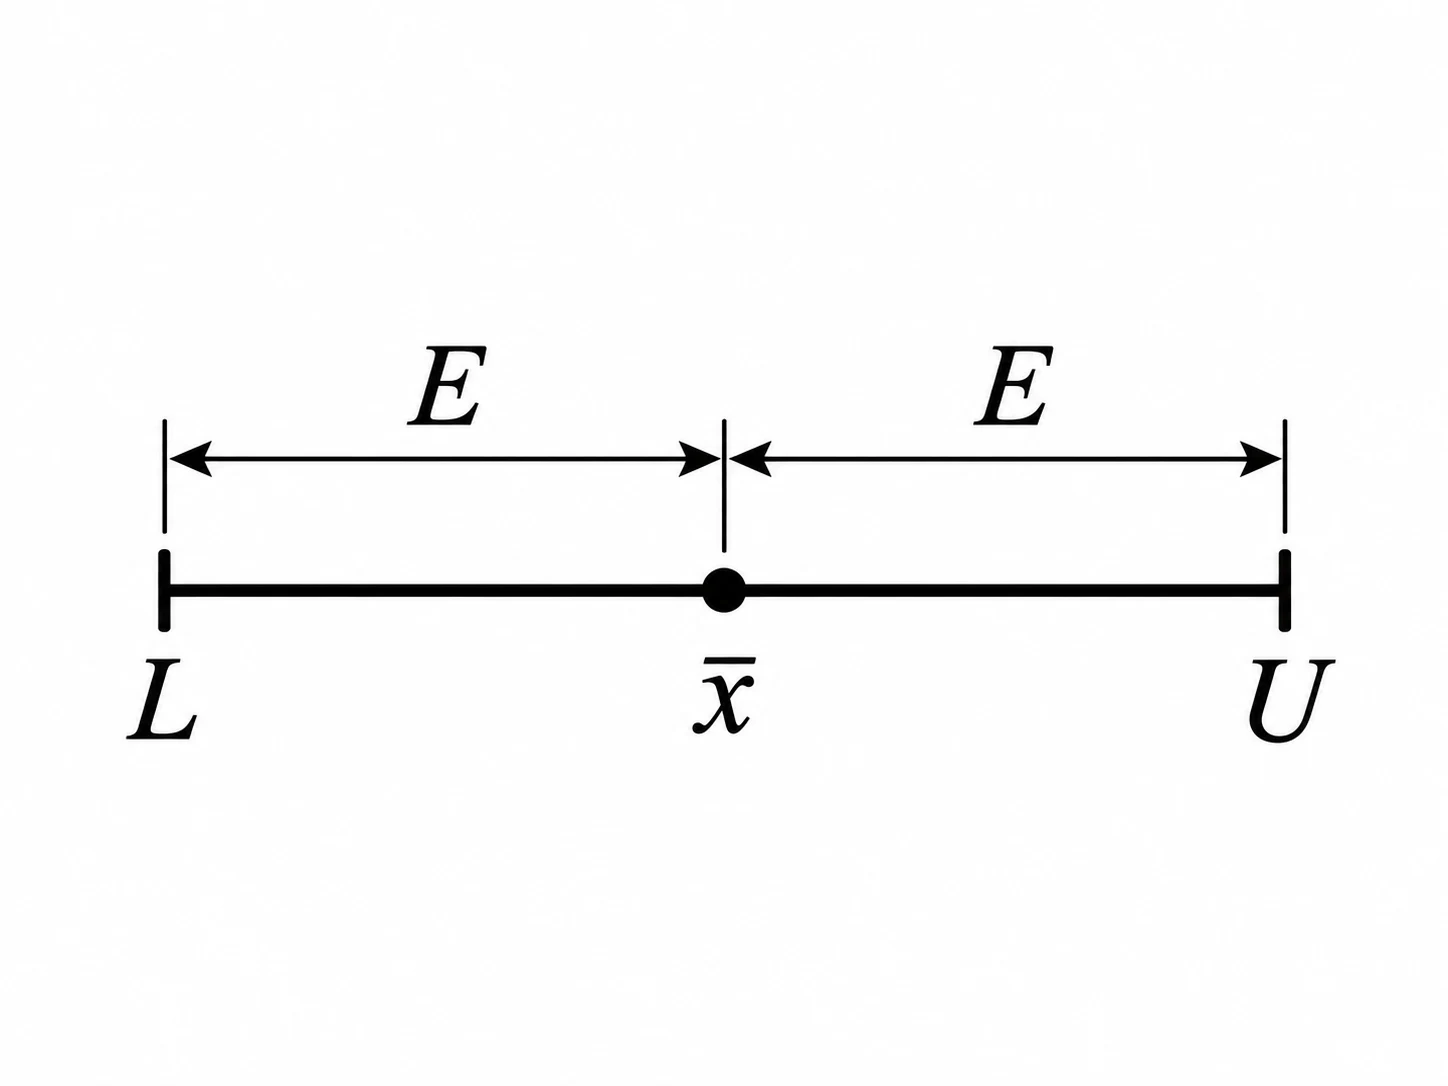
For a population mean when is known, a confidence interval is
Here is the sample mean, the normal critical value, the population standard deviation, and the sample size.
Try it yourself
Understand standard error
The sample mean changes from sample to sample. Its standard error, when observations are independent, is . Increasing the sample size reduces the uncertainty in the mean, but the improvement follows a square-root rule: multiplying by four halves . A normal-based method is appropriate when the parent population is normal, or when a representative sample is sufficiently large for a normal approximation. The interval concerns the population mean, not the spread of individual observations. A wide population distribution can still yield a precise estimate of its mean if the sample is large.
Choose a critical value
The confidence level fixes the amount of probability between two critical values of a reference distribution. Common two-sided normal critical values are for , for , and for . Calculate the margin , then state the lower and upper endpoints, keeping units and sensible precision. If is unknown and the assumptions support a one-sample t-interval, replace by the sample standard deviation and use a t critical value with degrees of freedom. Do not silently treat as known .
Interpret repeated coverage
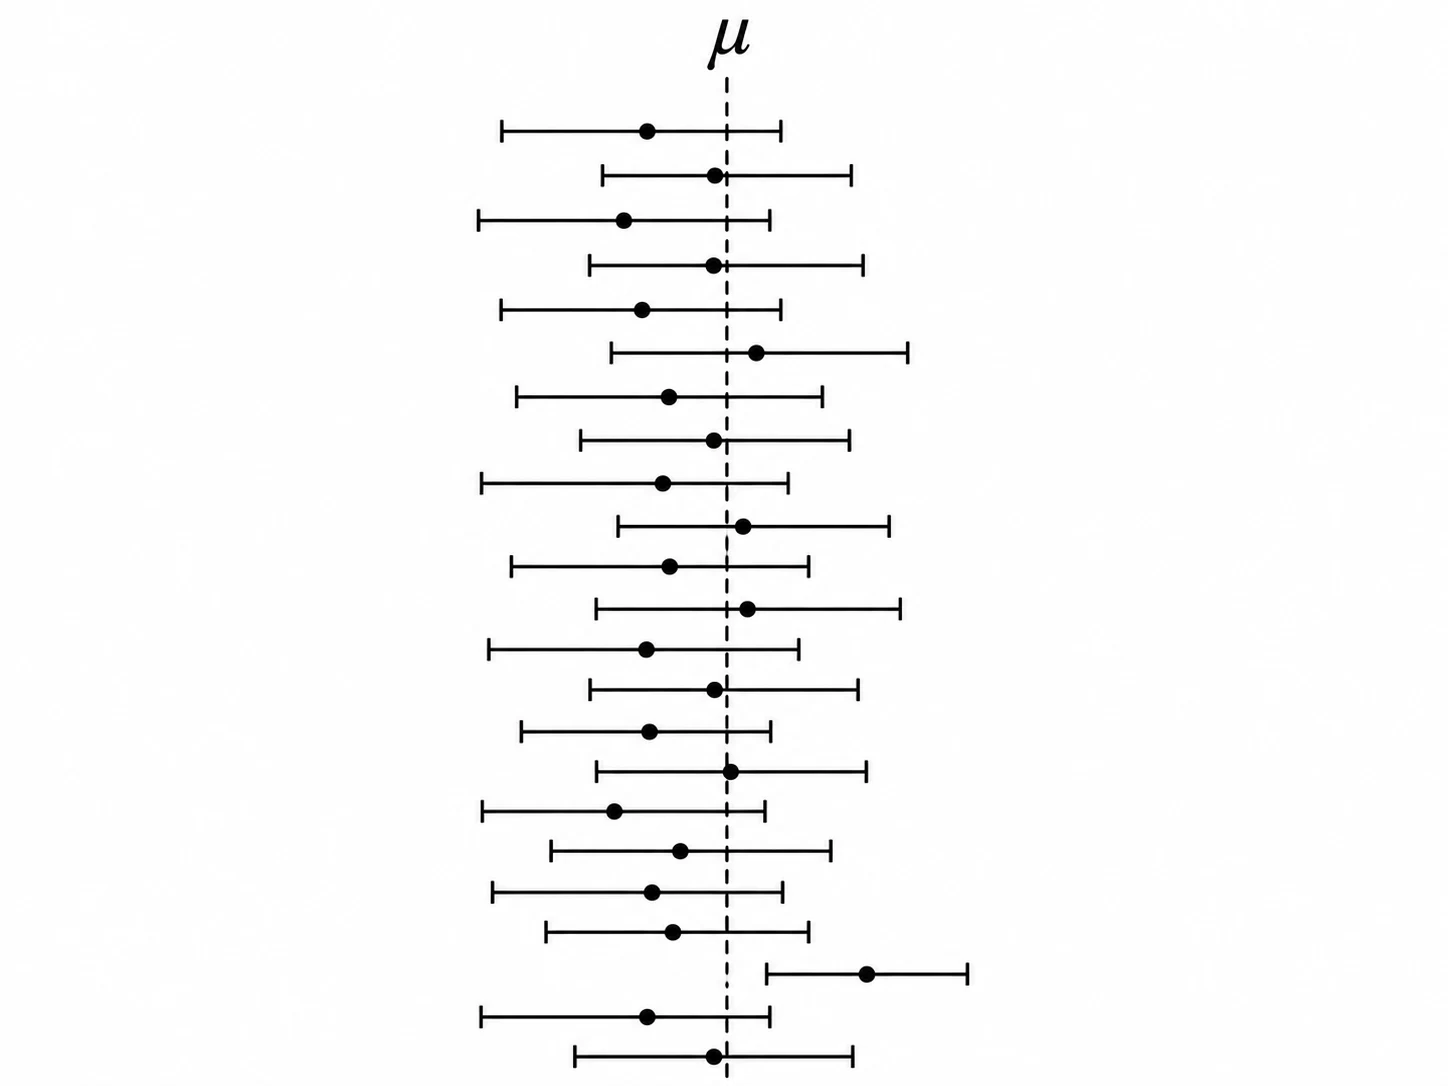
A confidence procedure captures the fixed population mean in about of intervals produced by repeated independent samples under the model assumptions. For one interval already calculated, the population mean does not move randomly between its endpoints. Therefore, the conventional frequentist interpretation is about long-run performance of the method, not a probability assigned to the fixed mean. A higher confidence level produces a wider interval for the same sample. A smaller interval indicates more precision, but neither narrowness nor nominal coverage can remove bias from poor sampling.
Worked example: Estimating the average length of rods
A random independent sample of rods has mean length . The population standard deviation is known to be . Assuming a normal sampling distribution for the mean, construct a two-sided confidence interval for the population mean length.
Show the solution
-
Identify the inputs: , , , and .
-
Standard error:
- Margin of error:
- Endpoints:
Answer: The confidence interval is . This procedure has long-run coverage if its assumptions hold.
Common mistakes
Using rather than for the uncertainty in a sample mean.
Calculate the standard error before multiplying by the critical value.
Treating confidence as a probability that a fixed mean is inside this specific interval.
Interpret confidence as repeated-sampling coverage of the interval procedure.
Using automatically when the population standard deviation is unknown.
Check whether the problem calls for an appropriate t-interval.
Reporting an interval without measurement units.
Attach the original variable's units to both endpoints and the margin of error.
Check your understanding
1. For a two-sided z-interval, and . Using , what is the margin of error?
2. A sample mean is , with known and . Assume the population is normally distributed. Using , which confidence interval is correct?
3. Which statement correctly interprets a confidence procedure?
Still not sure? Talk it through.
Waypoint Mentor's tutor explains this out loud, works through your own problems on a whiteboard, and checks you've got it. Free to start.