Hypothesis testing and p-values
Statistics · First-year university statistics · about 10 min
Hypothesis testing checks whether sample evidence is difficult to reconcile with a stated claim about a population. A small difference between a sample mean and the claimed mean may be ordinary sampling variation. A larger difference may be evidence against the claim. The test statistic measures the difference on a standardised scale, while the p-value measures how unusual the data would be if the null hypothesis were true.
The key idea
For a sample mean with a known population standard deviation, use
Here is the sample mean, the mean under the null hypothesis, the population standard deviation, and the sample size.
Try it yourself
State the hypotheses
Write the null hypothesis as a statement about a population parameter, such as . The alternative expresses what would count as evidence against it. For a difference in either direction, use . For an increase only, use . Decide the direction before looking at the data. Also choose the significance level, commonly . A one-sample z-test assumes independent observations and a known population standard deviation; a normally distributed population or a sufficiently large representative sample supports the normal approximation.
Calculate the p-value
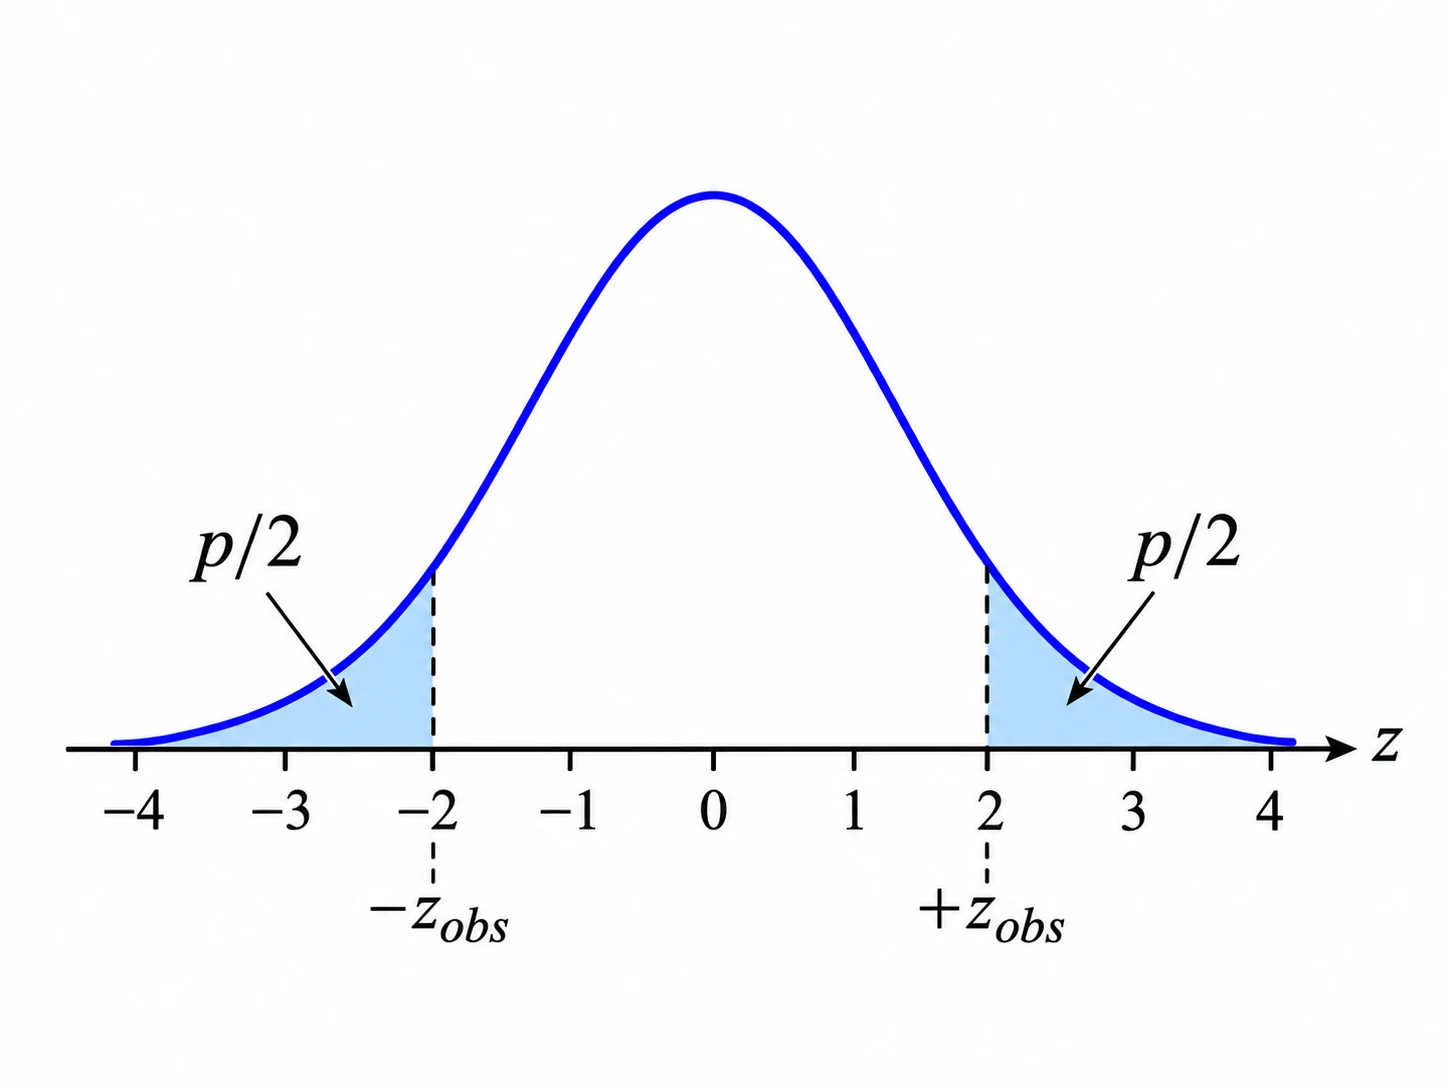
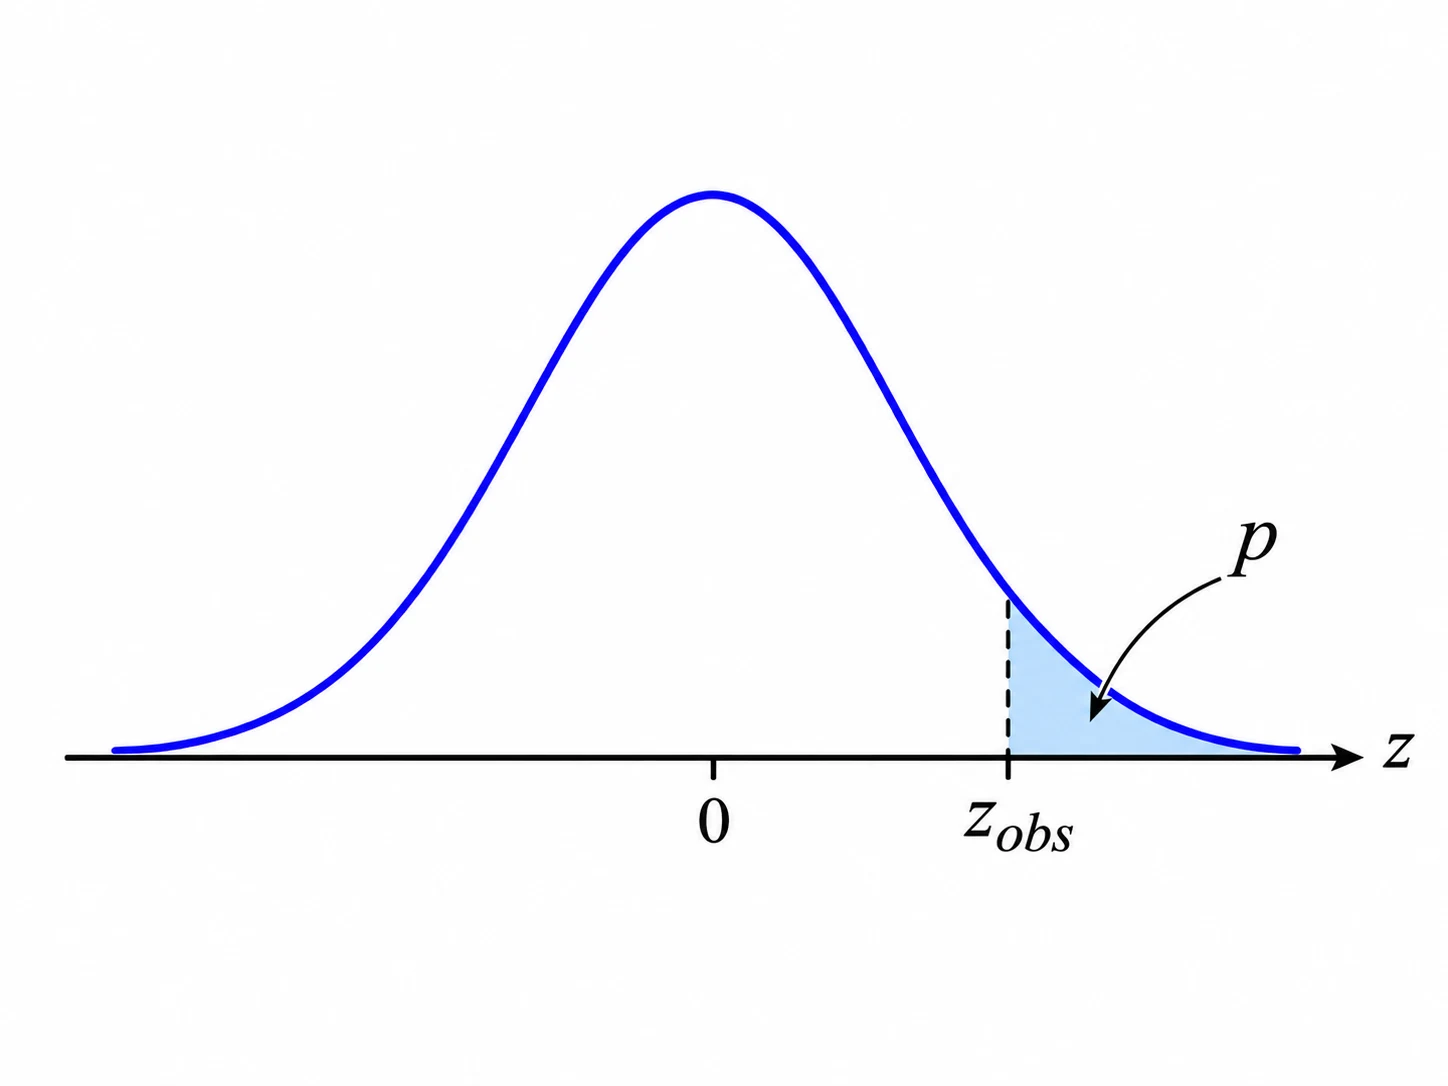
Under , the z-statistic follows the standard normal distribution under the stated assumptions. A two-sided test counts outcomes at least as extreme in both directions: , where is the standard normal cumulative distribution function. For an upper-tail test, use ; for a lower-tail test, use . Check the alternative hypothesis before choosing a tail. A p-value is a probability of data as extreme as those observed, assuming is true. It is not the probability that is true.
Make and report a decision
Compare with the previously selected . If , reject and report evidence for the alternative. If , fail to reject : this does not establish that is correct. A complete conclusion gives the test direction, statistic, p-value, significance level and real-world interpretation. Statistical significance is not the same as practical importance. A tiny shift can be detectable with a large sample, so discuss the estimated size of the effect as well as the result of the test.
Worked example: Checking the average fill mass
A filling process is claimed to have a population mean of . A random independent sample of packs has mean mass . The population standard deviation is known to be . Test at the significance level whether the population mean differs from the claim. Assume the normal approximation is appropriate.
Show the solution
-
Hypotheses: and . This is two-sided.
-
Standard error: .
-
Test statistic:
-
Two-sided p-value: .
-
Decision: Since , reject .
Answer: , . There is statistically significant evidence that the population mean fill mass differs from .
Common mistakes
Using a one-sided p-value for a two-sided alternative.
Read the sign in first and include both tails when uses .
Calling the p-value the probability that the null hypothesis is true.
Describe it as a tail probability calculated under the assumption that holds.
Claiming that failing to reject proves no effect.
Say the evidence is insufficient at the chosen significance level.
Substituting the sample standard deviation into a z-test without checking assumptions.
If the population standard deviation is unknown, investigate an appropriate t-test instead.
Check your understanding
1. For a two-sided z-test of , a sample has , and . What is the approximate p-value?
2. A valid test gives with . What is the correct decision?
3. An upper-tail test uses and . With , known and , what is the approximate p-value?
Still not sure? Talk it through.
Waypoint Mentor's tutor explains this out loud, works through your own problems on a whiteboard, and checks you've got it. Free to start.