Linear regression and least squares
Statistics · First-year university statistics · about 10 min
When measurements tend to rise or fall together, a straight line can summarise the overall pattern. Linear regression chooses a line that fits the observed points by a specific rule, rather than by eye. The resulting slope, intercept and residuals are useful for describing trends and making predictions, provided the assumptions and limits of the model are understood.
The key idea
The least-squares line and its coefficients are
Here predicts the response , is the slope, and is the intercept.
Try it yourself
Read the fitted line
Each observed pair has a predictor and a measured response. The fitted value is what the straight-line model predicts at . The slope is the predicted change in for a one-unit rise in ; its units are response units divided by predictor units. The intercept is the predicted response at , although that value may be outside the observed range and may have no useful physical interpretation. Keep the variables in the order stated by the problem. Reversing predictor and response changes the regression.
Least squares and residuals
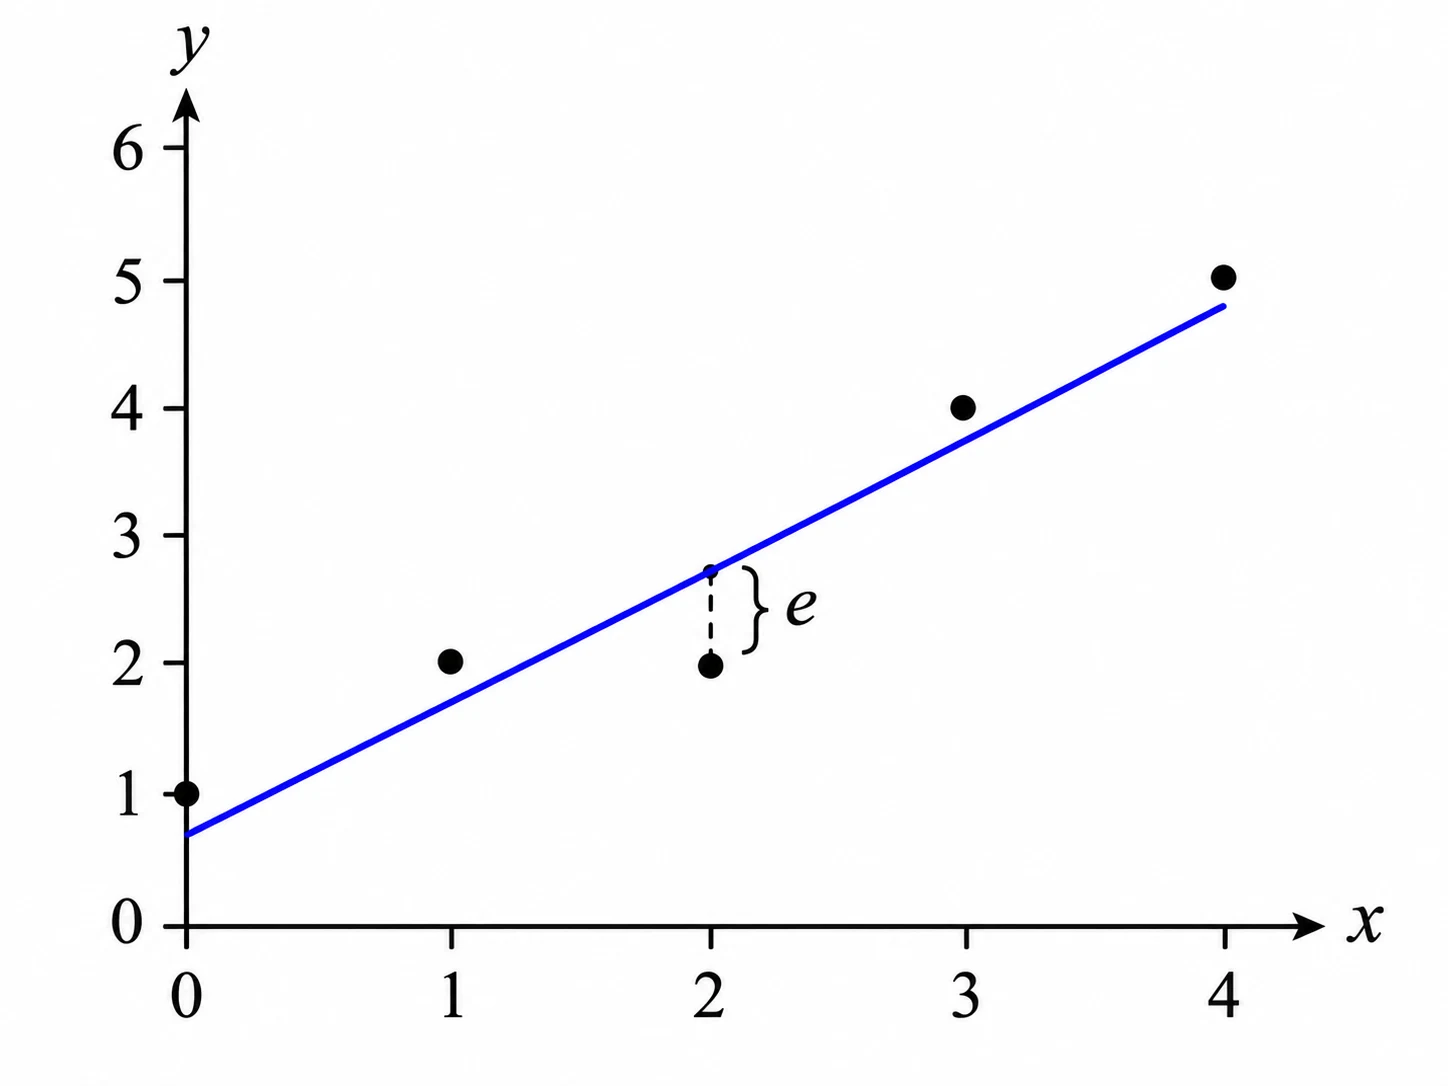
The residual for observation is , the vertical distance from a data point to the fitted line. Ordinary least squares chooses the coefficients to minimise . Squaring avoids positive and negative residuals cancelling and gives larger errors more weight. For regression with an intercept, the fitted line passes through . The sums and provide a compact calculation. If all the values are identical, and a unique slope cannot be obtained.
Predictions and limitations
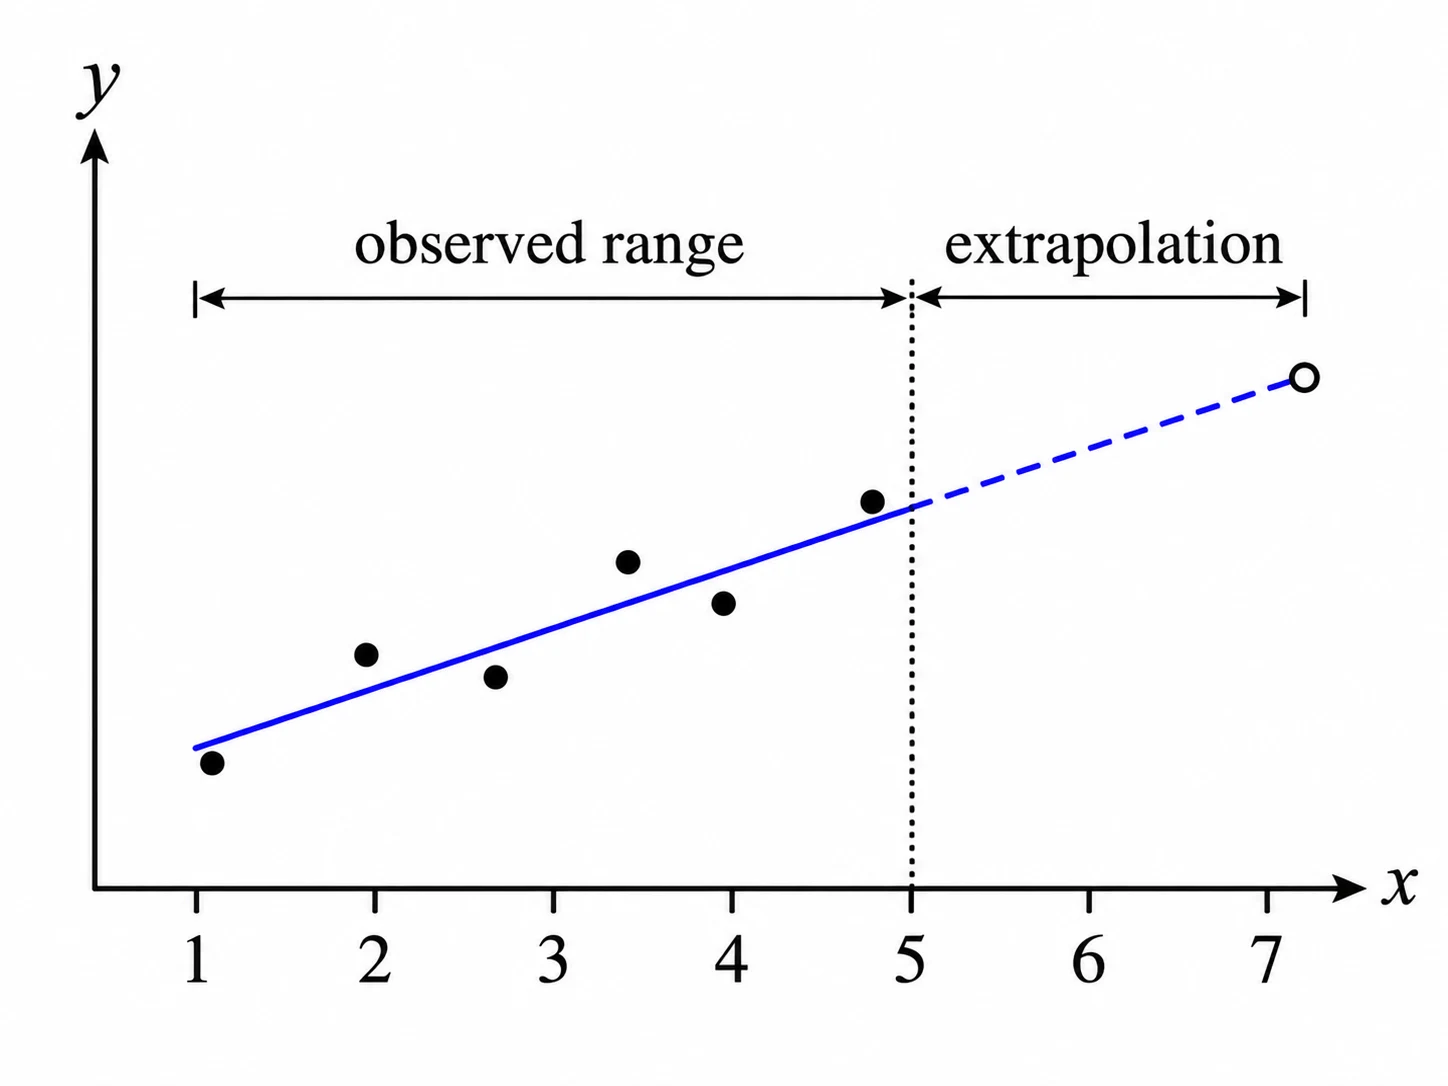
A prediction inside the measured range is interpolation. A prediction beyond the data is extrapolation and deserves extra caution, even if the fitted line looks convincing. Plot the points and inspect the residuals: a curved pattern suggests a straight line may be unsuitable; a widening spread indicates changing variability. A correlation or a fitted trend does not prove causation. Outliers can strongly affect least-squares coefficients, so do not rely solely on a single calculated slope. Always report the predicted response with its units and distinguish predictions from direct measurements.
Worked example: Fitting position measurements over time
A sensor records position in metres at time in seconds. The five pairs are , , , and . Fit a least-squares straight line, predict the position at , and calculate the residual for the observation at .
Show the solution
- Calculate the means:
- Calculate the sums:
- Find slope and intercept:
- Predict and check a residual: . At , .
Answer: , predicted position , residual .
Common mistakes
Subtracting observed from fitted values when calculating a residual.
Use , with the observed value first.
Assuming the least-squares line passes through every point.
It minimises the sum of squared residuals; individual residuals are usually non-zero.
Giving a slope without its units.
Divide the response units by the predictor units.
Treating extrapolated predictions or correlation as proof of a physical cause.
Check the data range, alternative explanations and the residual pattern.
Check your understanding
1. A fitted line is . What does it predict at ?
2. At one data point the measured response is and the fitted response is . What is the residual?
3. What quantity does ordinary least squares minimise for a line fitted with vertical residuals?
Still not sure? Talk it through.
Waypoint Mentor's tutor explains this out loud, works through your own problems on a whiteboard, and checks you've got it. Free to start.