Motion graphs: displacement, velocity and acceleration
Physics · Senior school physics · about 10 min
Motion graphs show the same journey in different ways. A position-time graph tracks where an object is, a velocity-time graph shows how quickly position changes and an acceleration-time graph describes how velocity changes. Reading their gradients and areas is an efficient way to solve many kinematics questions.
The key idea
Gradients give rates of change, while areas give accumulated changes:
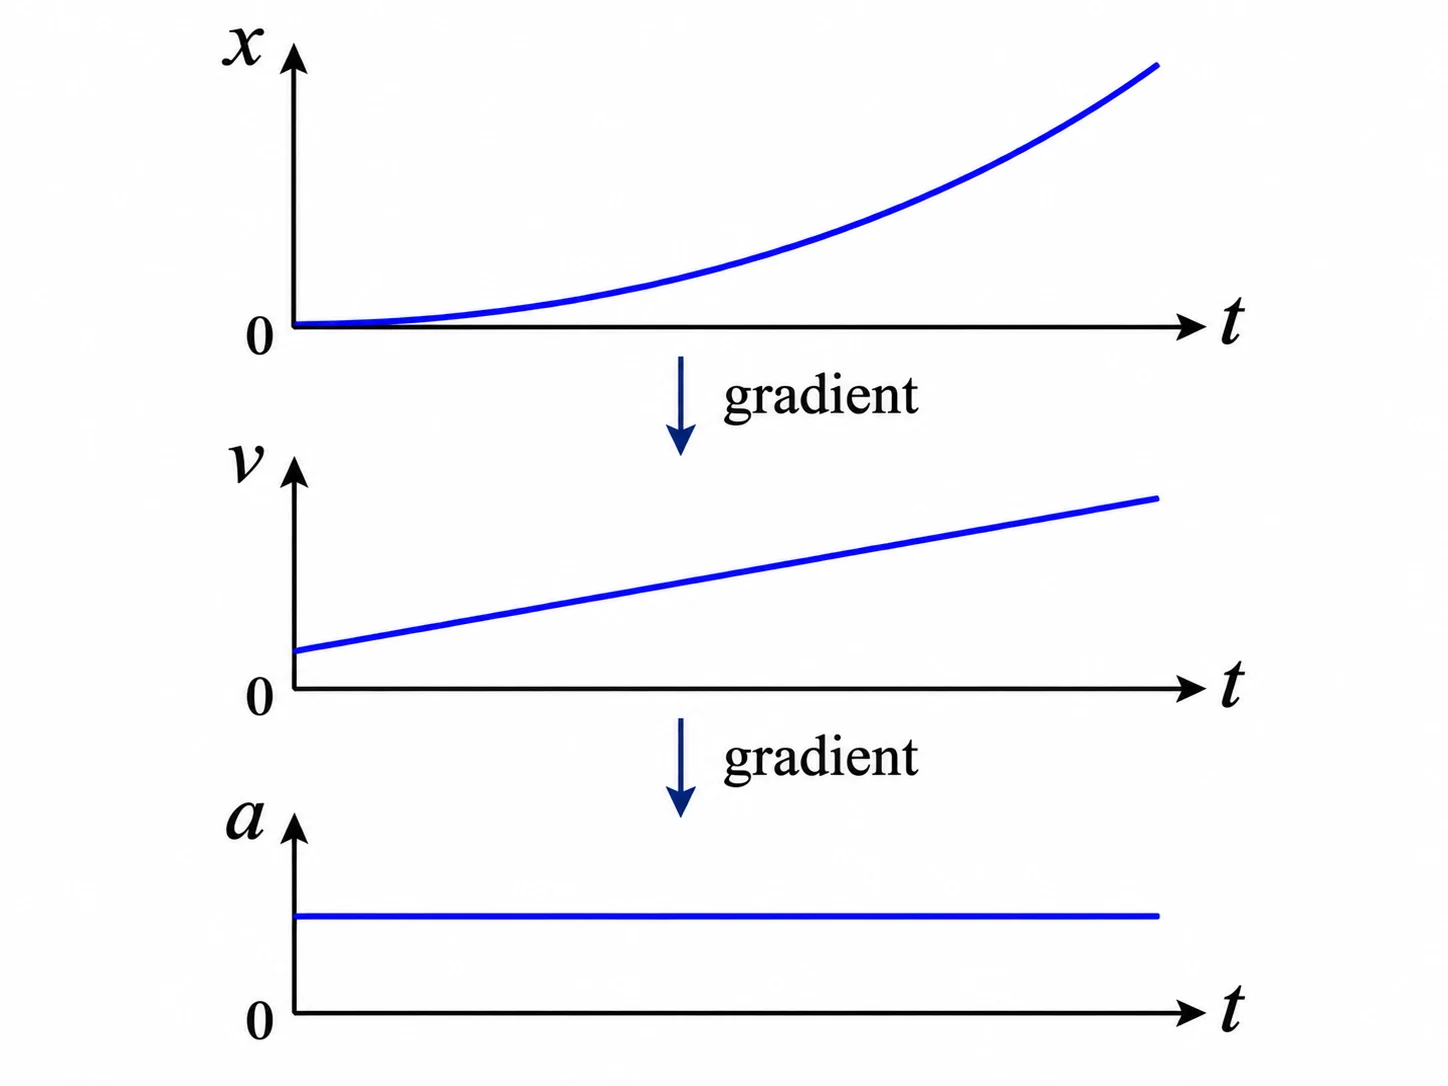
The gradient of a position-time graph is velocity. The gradient of a velocity-time graph is acceleration. Signed area under a velocity-time graph is displacement.
Position-time graphs
A position-time graph has position vertically and time horizontally. Its gradient gives velocity in . A straight line with positive gradient shows constant positive velocity; a horizontal line shows rest. A curved line indicates that velocity is changing, and its instantaneous gradient is the tangent slope at that time. A negative slope means movement in the negative direction, not an impossible speed. Do not interpret the height of the position graph as speed. To find displacement between two times, subtract the initial position from the final position.
Velocity-time graphs
The gradient of a velocity-time graph gives acceleration in . A horizontal line has zero acceleration, even when velocity is not zero. The signed area between the velocity curve and the time axis gives displacement: regions above the axis contribute positively, and regions below contribute negatively. For constant velocity, area is a rectangle; for uniform acceleration, use a rectangle and triangle or a trapezium. Total distance travelled is found by adding the absolute areas, whereas displacement retains their signs. A downward sloping line is negative acceleration, but an object only slows down when acceleration opposes its velocity.
Acceleration-time graphs
On an acceleration-time graph, signed area over an interval is the change in velocity, . A constant positive acceleration produces an upward-sloping straight line on a velocity-time graph and a curved position-time graph. If acceleration is zero, velocity is constant and position changes linearly. Always distinguish initial values from changes: an area under an acceleration graph gives , not by itself. For a piecewise journey, analyse each time interval separately and carry the final velocity and position into the next interval.
Worked example: A vehicle accelerating, cruising and stopping
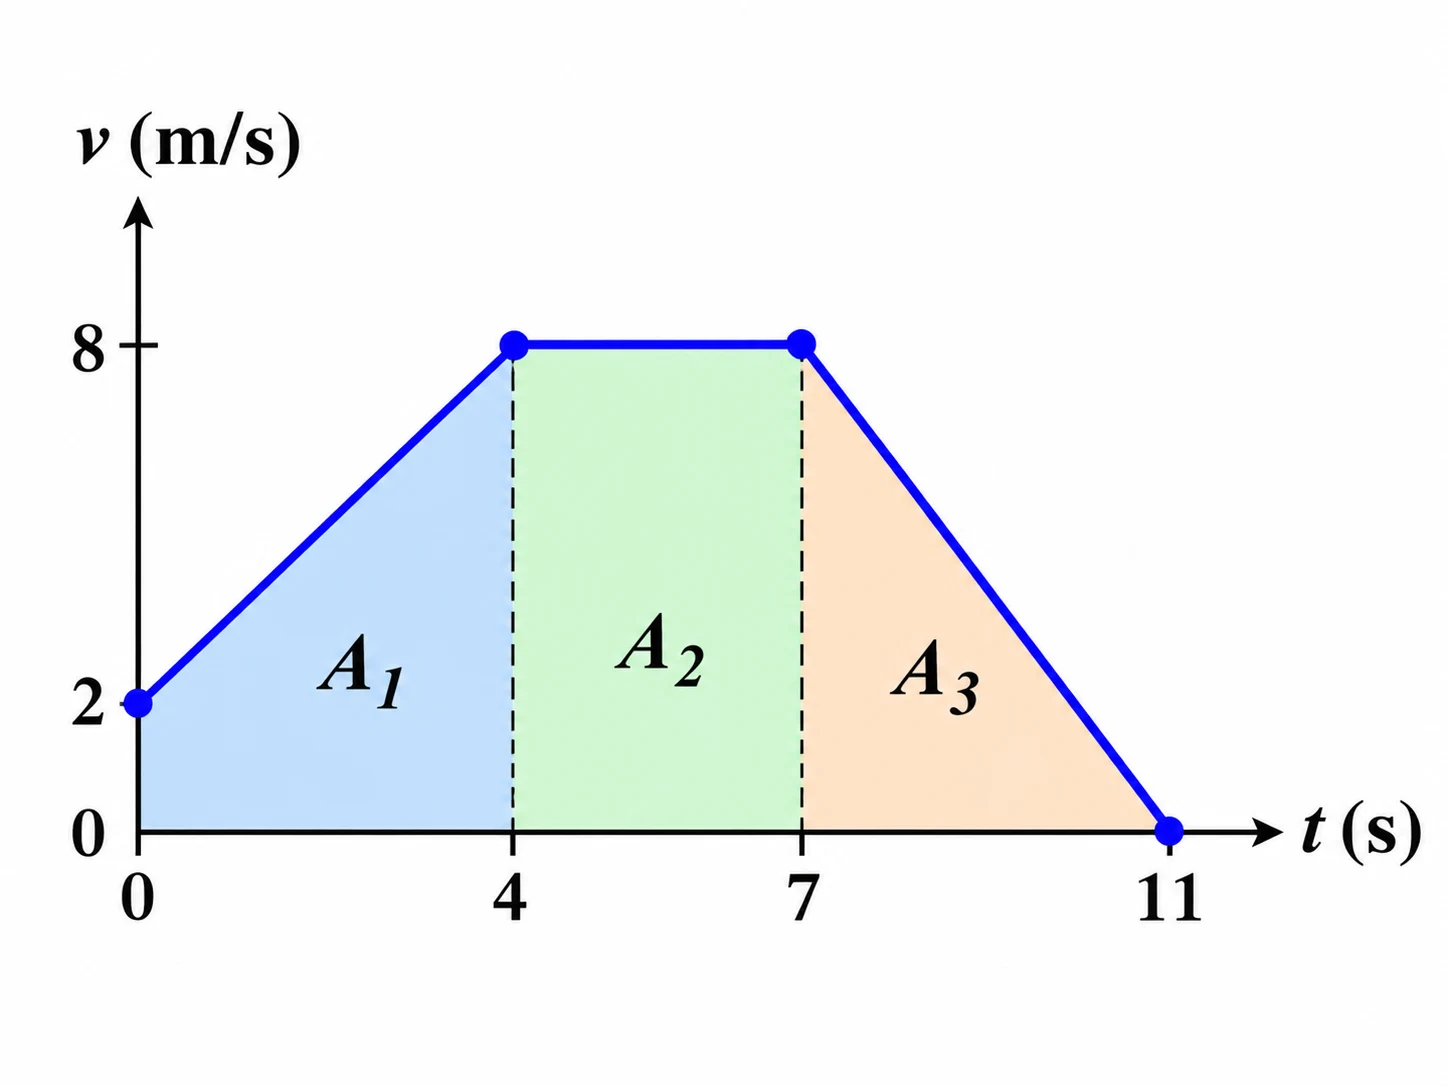
A vehicle starts at position with velocity . It accelerates uniformly at for , then travels at constant speed for . It finally brakes uniformly at for . Find its velocity after the first stage, the displacement in each stage and its final position.
Show the solution
Step 1: First stage, accelerate. From the gradient of the velocity-time graph:
The area under the first segment is a trapezium:
Step 2: Second stage, constant speed. The rectangular area is
Step 3: Third stage, brake. The final velocity is
The triangular area is
Step 4: Add signed displacements. All velocities are non-negative during the journey:
The stage boundaries occur at , and .
Answer: after stage one; displacements of , and ; final position .
Common mistakes
Finding distance from signed area without checking for negative velocity
Use the signed area for displacement; add the magnitudes of areas for total distance.
Reading acceleration from the height of a velocity-time graph
Acceleration is the gradient of the velocity graph, not its vertical coordinate.
Assuming negative acceleration always means slowing down
Check the signs of both velocity and acceleration; opposing signs reduce speed.
Resetting initial velocity or position at each stage
Carry each stage's final value into the next stage before finding its gradient or area.
Check your understanding
1. A position-time graph is a straight line from to . What is the velocity?
2. An object maintains a velocity of for . What is its displacement?
3. Velocity decreases uniformly from to over . What is the acceleration?
Still not sure? Talk it through.
Waypoint Mentor's tutor explains this out loud, works through your own problems on a whiteboard, and checks you've got it. Free to start.